VISUALIZING REAL-TIME SENSOR DATA WITH AZURE WEB APPS
- Layout for this exercise:
* This exercise is based in the previous one
1 - Creating the Web App
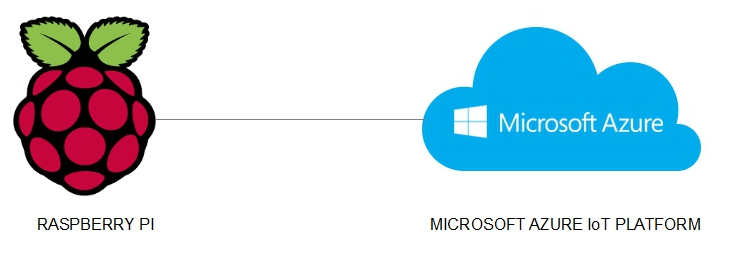
- The goal of this exercise is to visualize real-time sensor data received by an IoT hub by running a web application that is hosted on a Web App.
- Starting from the Azure portal, clicking New -> Web + Mobile -> Web App:


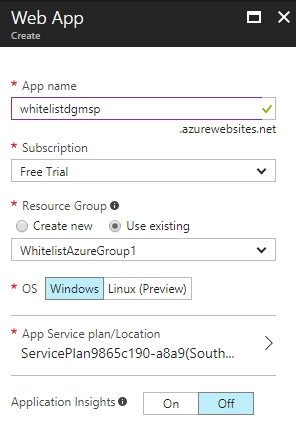
- Filling the required data, like App name, Resource Group, etc .. and pinning to the Dashboard:

- The Web App starts the deployment process:

- An URL is generated that later will be used to visualize real-time sensor data:

2 - Adding a consumer group to the IoT hub
- Consumer groups are used by applications to pull data from an Azure IoT Hub.
- Going back to the Azure portal and opening the IoT Hub:

- Clicking Endpoints -> Events:


- Entering a Consumer group name and saving:


3 - Configuring the Web App to read data from an IoT hub
- Opening the Web App:

- Clicking Settings -> Application settings:

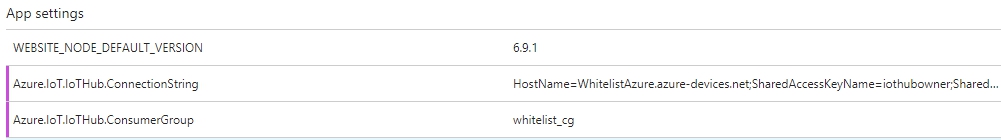
- Entering two key/value pairs. The first one corresponds to the Connection String obtained in previous exercises, the second one refers to the Consumer group name:
- Saving:

- Enabling Web sockets:
- Going to Deployment option -> Choose Source -> Local Git Repository:


- Setting up authentication with username + password:


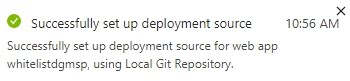
- The Web App is eventually successfully deployed:
- From Overview, let's copy the Git clone URL that will be used later:
4 - Uploading a web application to be hosted by the Web App
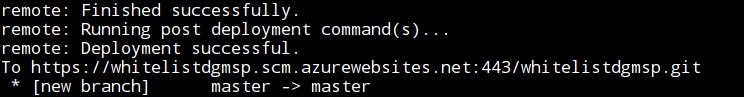
- Now, let's go to the Raspberry Pi device and open a terminal window.
- Entering these commands using:
a) Git clone URL from the previous point
b) appropriate authentication credentials (username + passwords) from the previous point


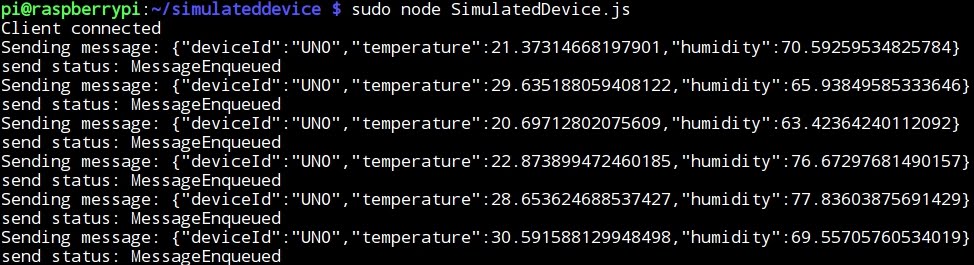
- Running the simulated Temperature/Humidity sensor device:
- Browsing the URL generated before:
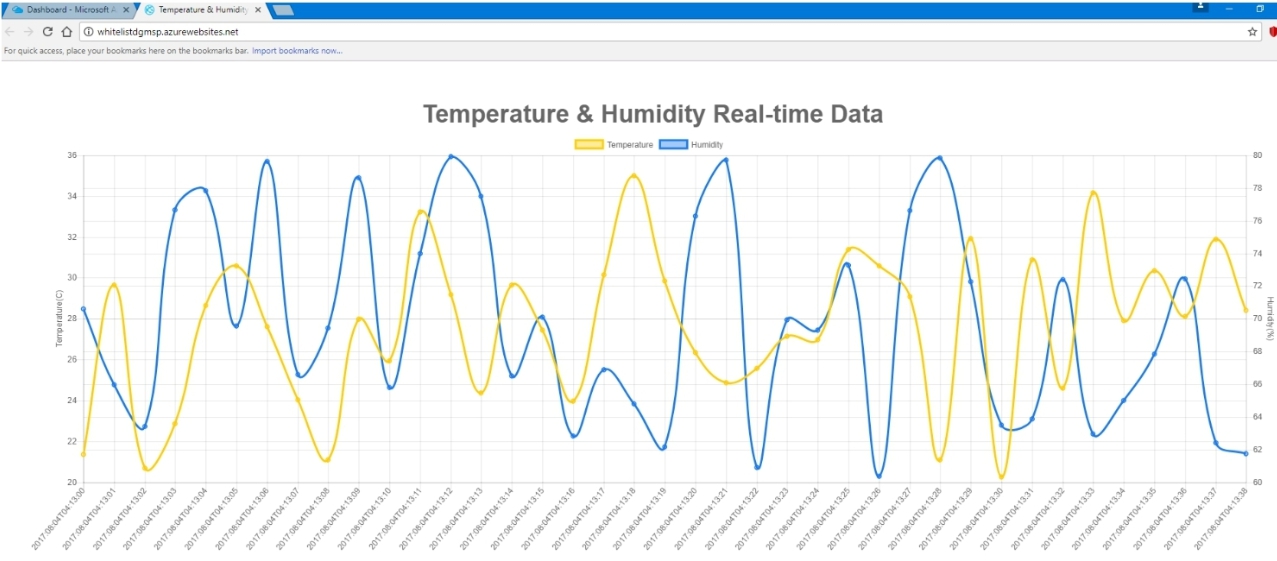
- Finally, the Temperature/Humidity real-time data generated by the simulated device is visualized: